Splunk Enterprise is known as a de-facto do-it-all log collector, that in reality is fairly easy to start with, but can be complex to master. Starting with a single-instance-one-stop-access to all log data and being able to scale to a full featured SIEM solution consisting of multiple connected instances in multiple locations. This post is the starting point of a series of blog posts covering Splunk Enterprise from the simple setup to the real world use cases utilising a more complex Splunk infrastructure. The Mint Security way.
Mint Security has designed and built managed Splunk Enterprise installations from the ground up, starting with Linux and access hardening and providing customers with Dashboards they love to use. We see Splunk as an essential part of a security minded organisation’s tools, and as such, it too must be built with security, manageability and usability in mind.

Getting started
Getting started with Splunk is easy: point you browser to https://www.splunk.com and Sign Up as a user or login with your existing credentials if you have already registered. Splunk Enterprise is free to download, and can be evaluated with all functionality enabled for 60 days.
Splunk Enterprise can be used for free even after the 60 day evaluation period, with a reduced set of functionality and a limit of 500MB / day indexing volume. Perfect for your personal use!
There are various versions and installation methods available. We recommend using the Linux RPM installation unless you have some very good reason to use something else, like Windows. Managing the Linux RPM version is just the most straight forward thing to do in the long run.
When taking your first steps with Splunk Enterprise, it is easiest to install the package manually, so as root -user (package name may be different if version has updated since), do
# rpm -Uvh splunk-7.2.1-be11b2c46e23-linux-2.6-x86_64.rpm
After installation, enable Splunk to start automatically when the server starts up, with
# /opt/splunk/bin/splunk enable boot-start
At this point you need to accept the license agreement to proceed.
After enabling automatic start, startup Splunk Enterprise with
# /opt/splunk/bin/splunk start
You can also start Splunk with systemctl, but using the actual startup command provides you with information about the startup process and an immediate view of possible errors.
After startup, Splunk Web is available at port 8000.
First time access
Initial access to Splunk Web requires you to select an admin password, which by default is changeme. As admin user has all possible power, choose your password wisely and store it in a safe place, like 1Password. It is also recommended to create a separate user account for day to day use.
deletecapability is by default disabled even for an admin user. We recommend keeping it that way.
Importing data
Splunk is setup to index internal data right after installation. All internal data is stored in indexes that are prefixed with an underscore (_), which is good to remember when you start choosing your own index names later on
Remember: do not prefix your own indexes with an underscore
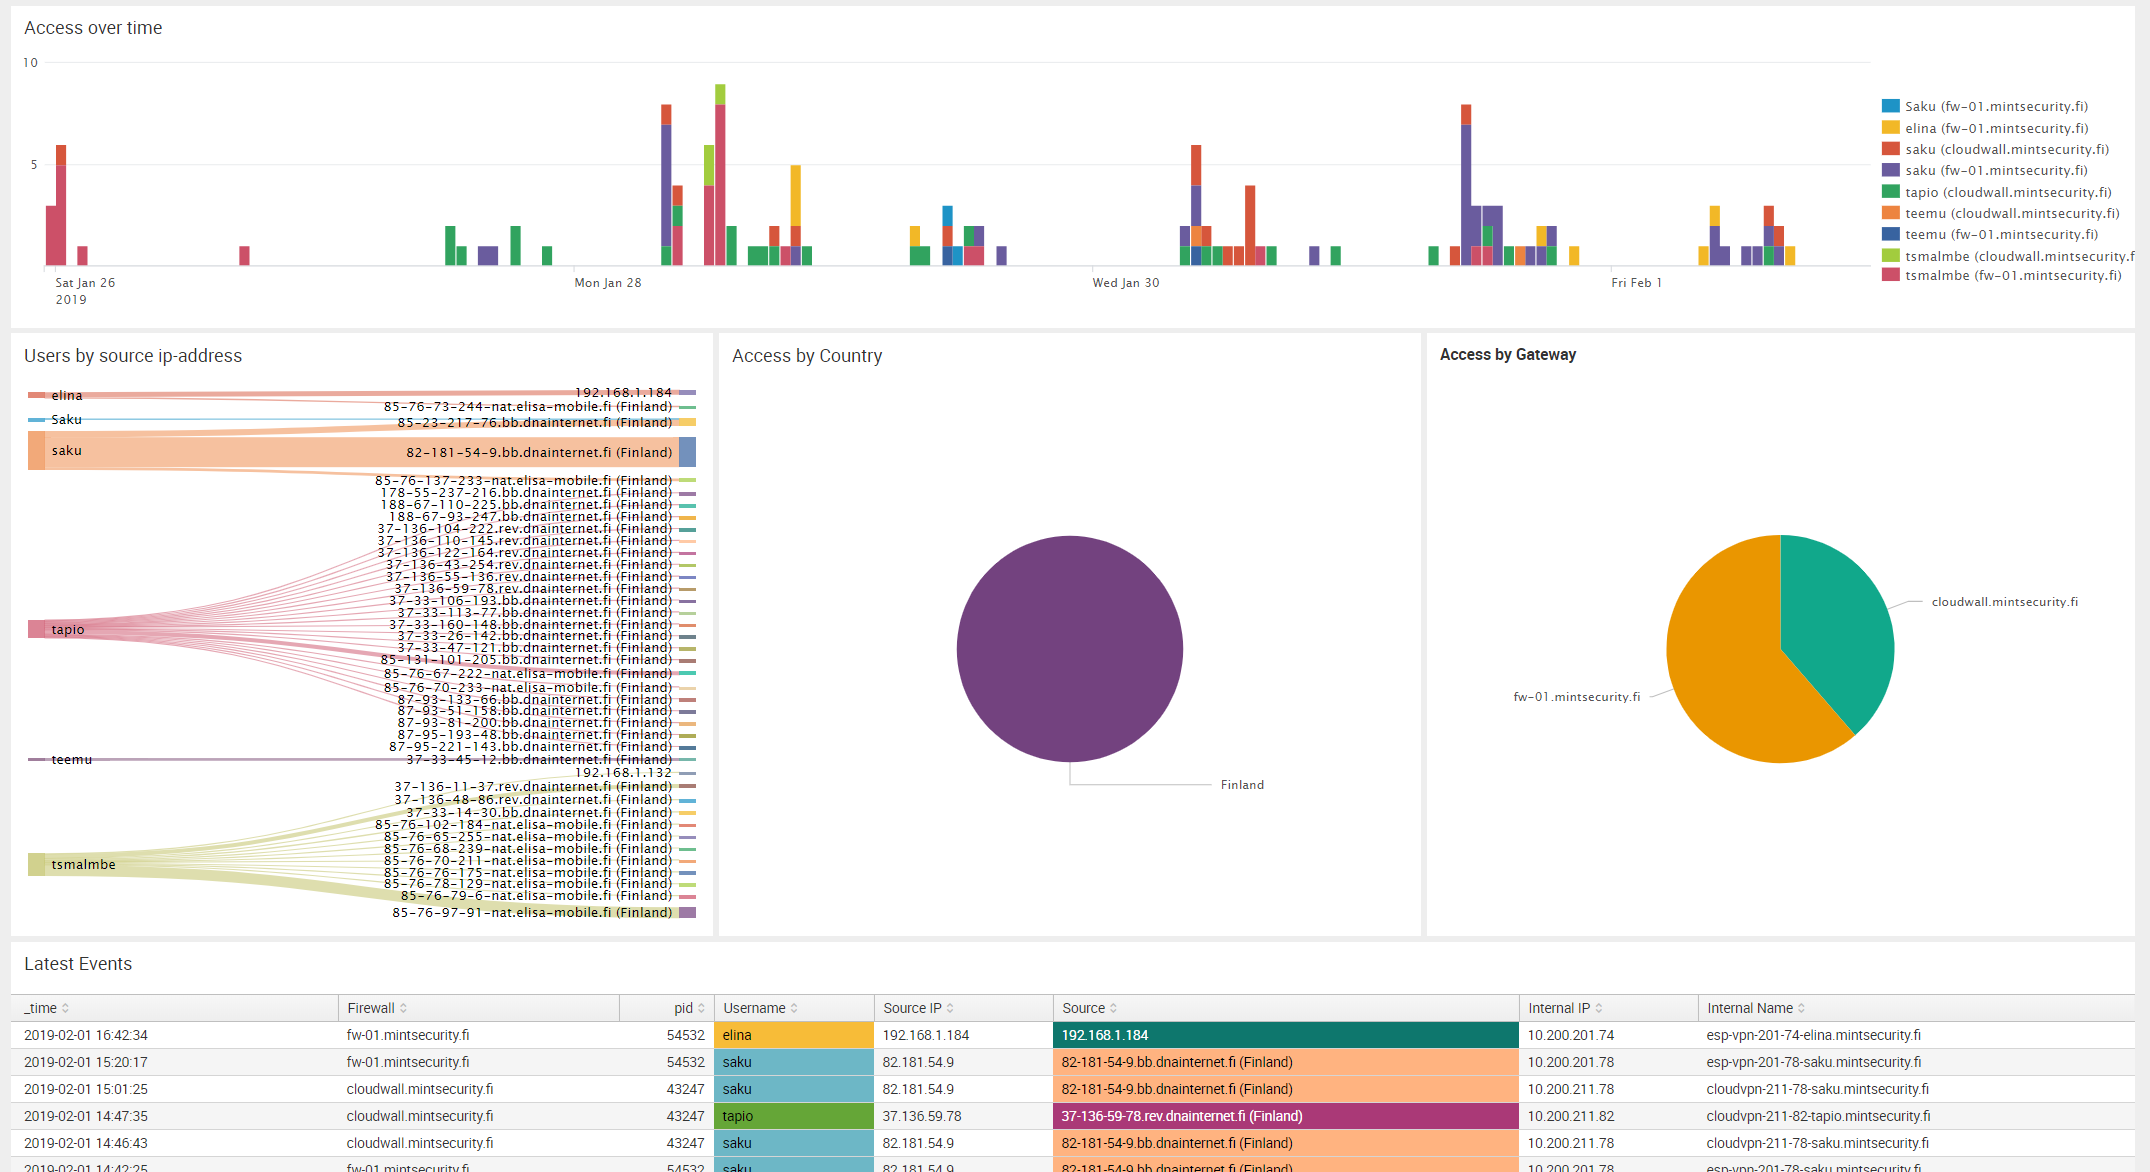
At this point, you can already check out how indexed data can be easily searched and viewed in Splunk. Everything is built with Apps, even the Splunk Web internal views, so open “Search & Reporting” App and type a search string of index=_* (when looking into system indexes, the prefix must be included even in a wild card search). You will be presented with a view similar to below screenshot
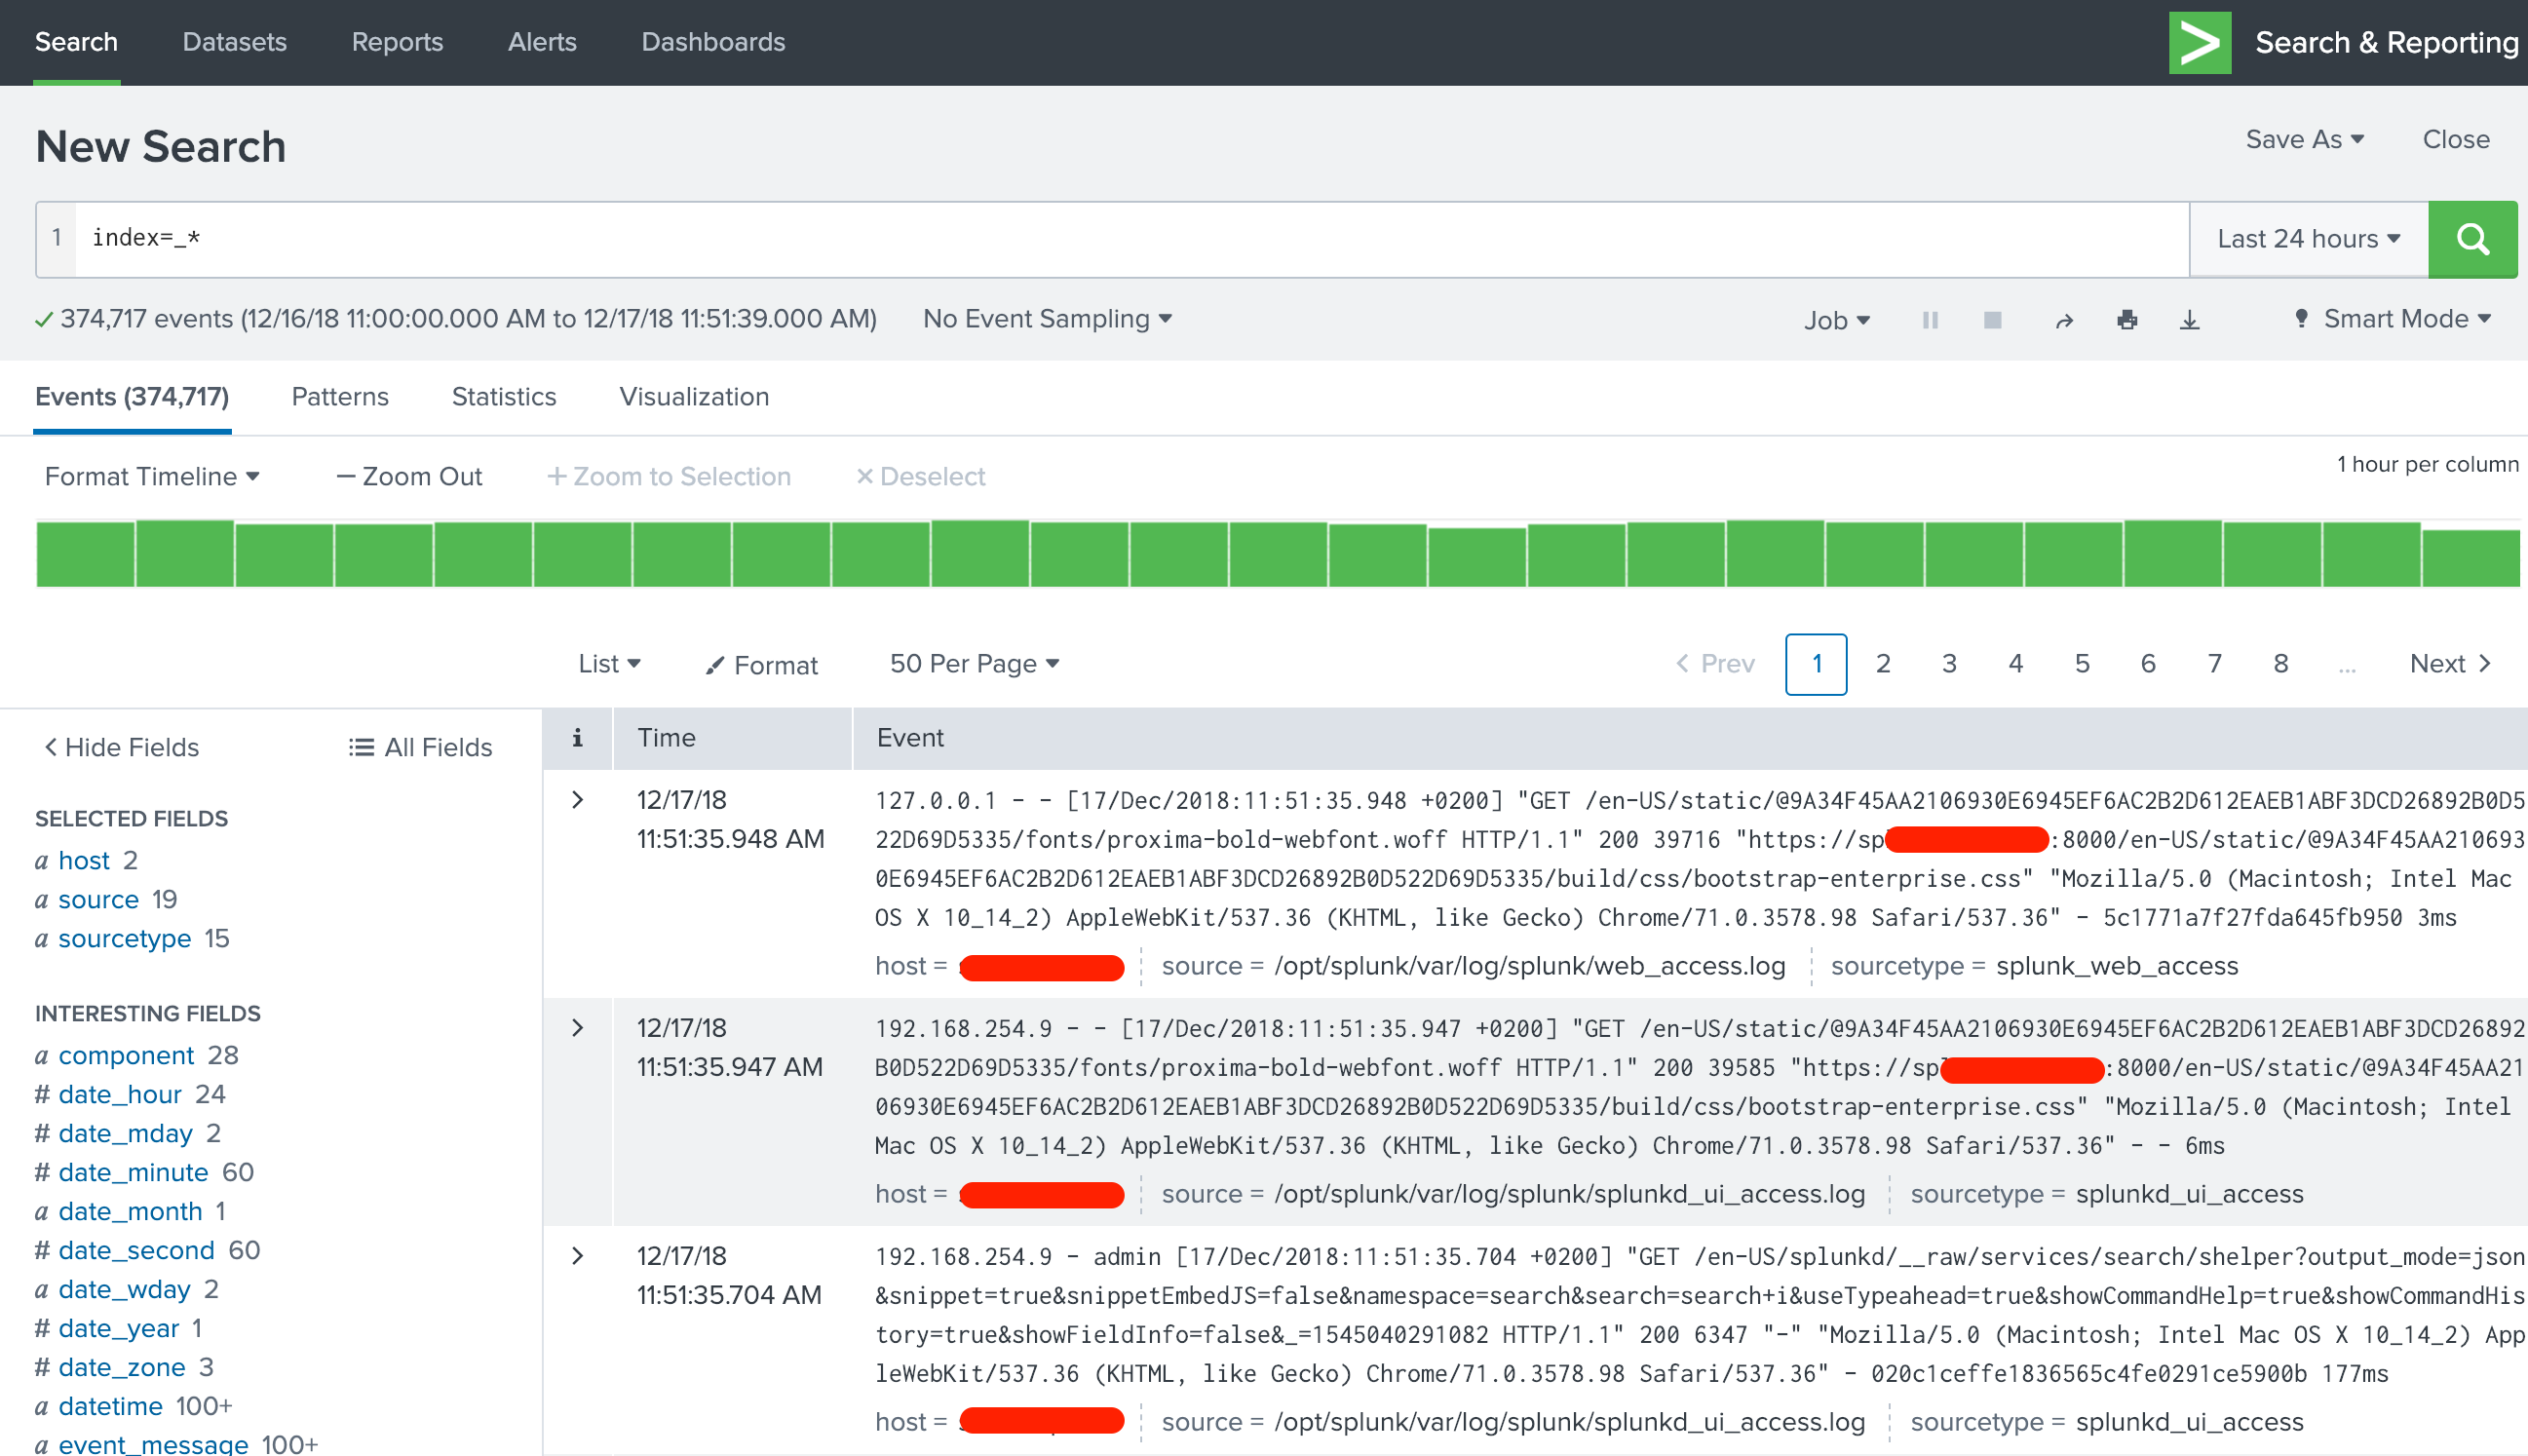
Your first search
Clicking the arrow in the leftmost column opens up details about the log entry.
Splunk knows a number of different file formats right out of the box, and can be taught to learn any kind of file format you can possibly images and extract fields from the data, with a little bit of regular expressions. This allows for a real deep-dive into information indexed by Splunk Enterprise.
Most of the information in the view is clickable. If you hover mouse over the log entry, data starts getting highlighted and you can for example easily add new search strings limiting the results, straight from a log event of interest.
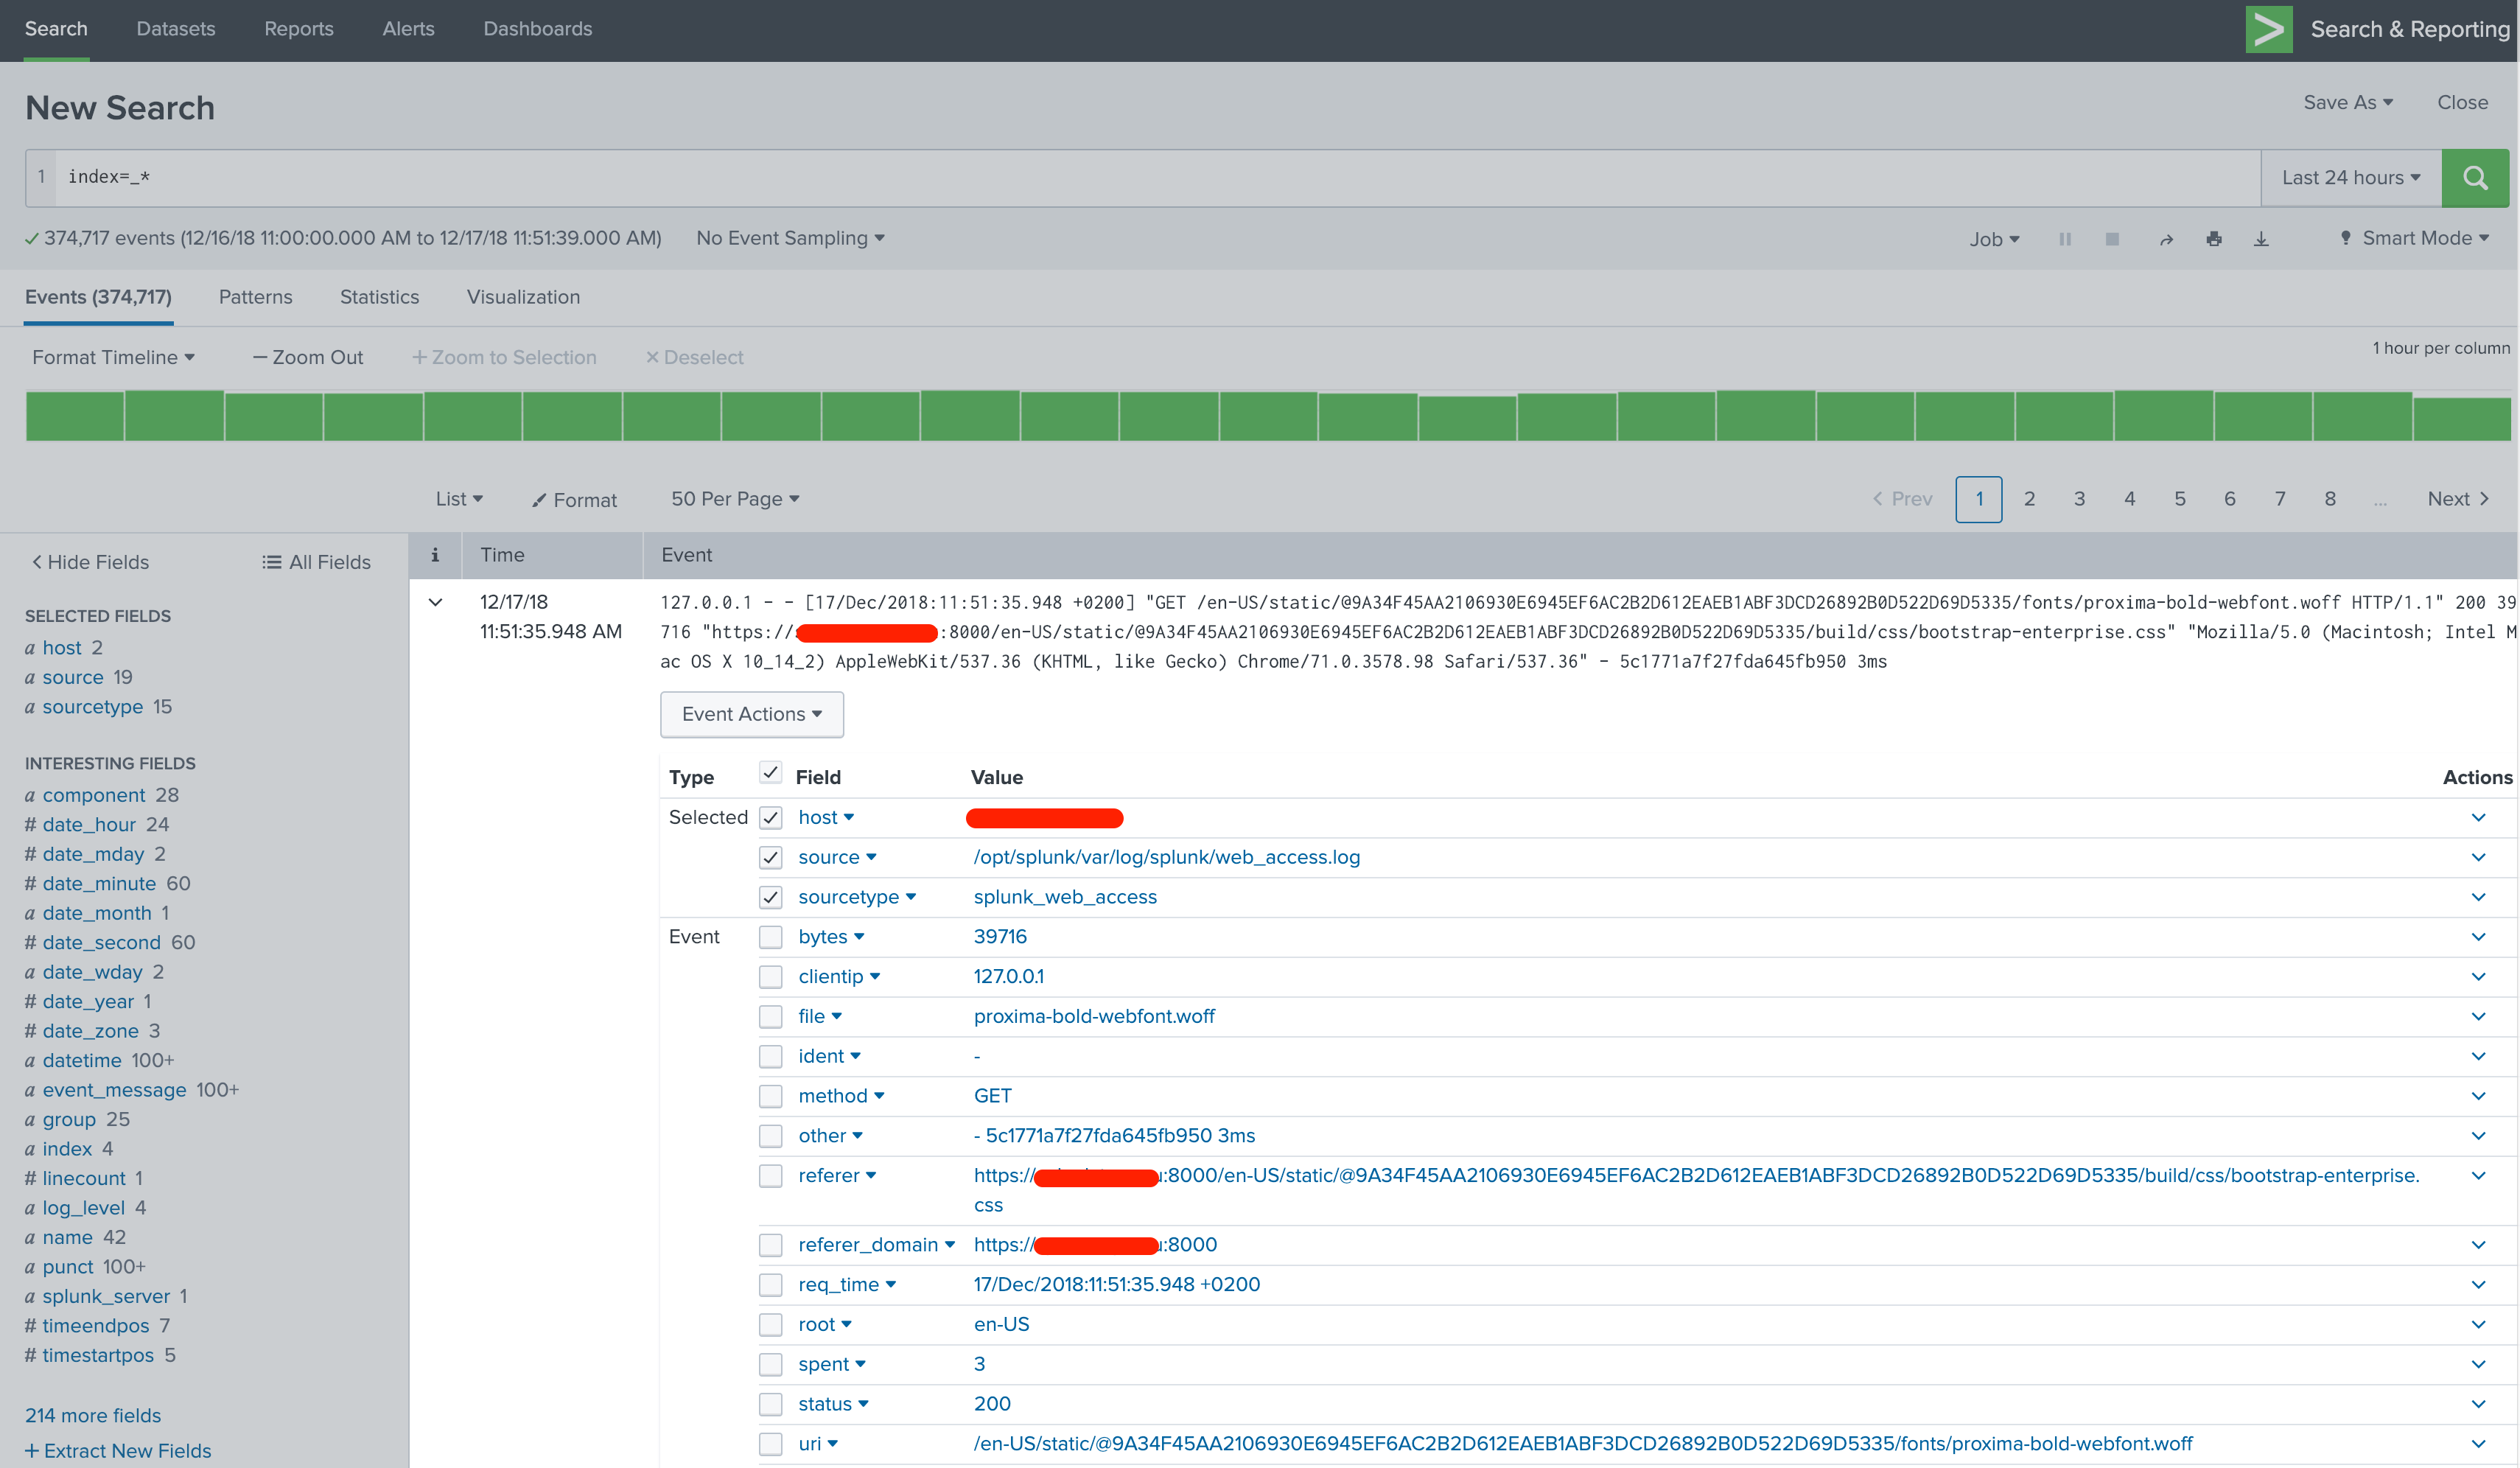
How data is organized in Splunk
The details reveal the way how Splunk handles the data. All data is split into searchable fields.
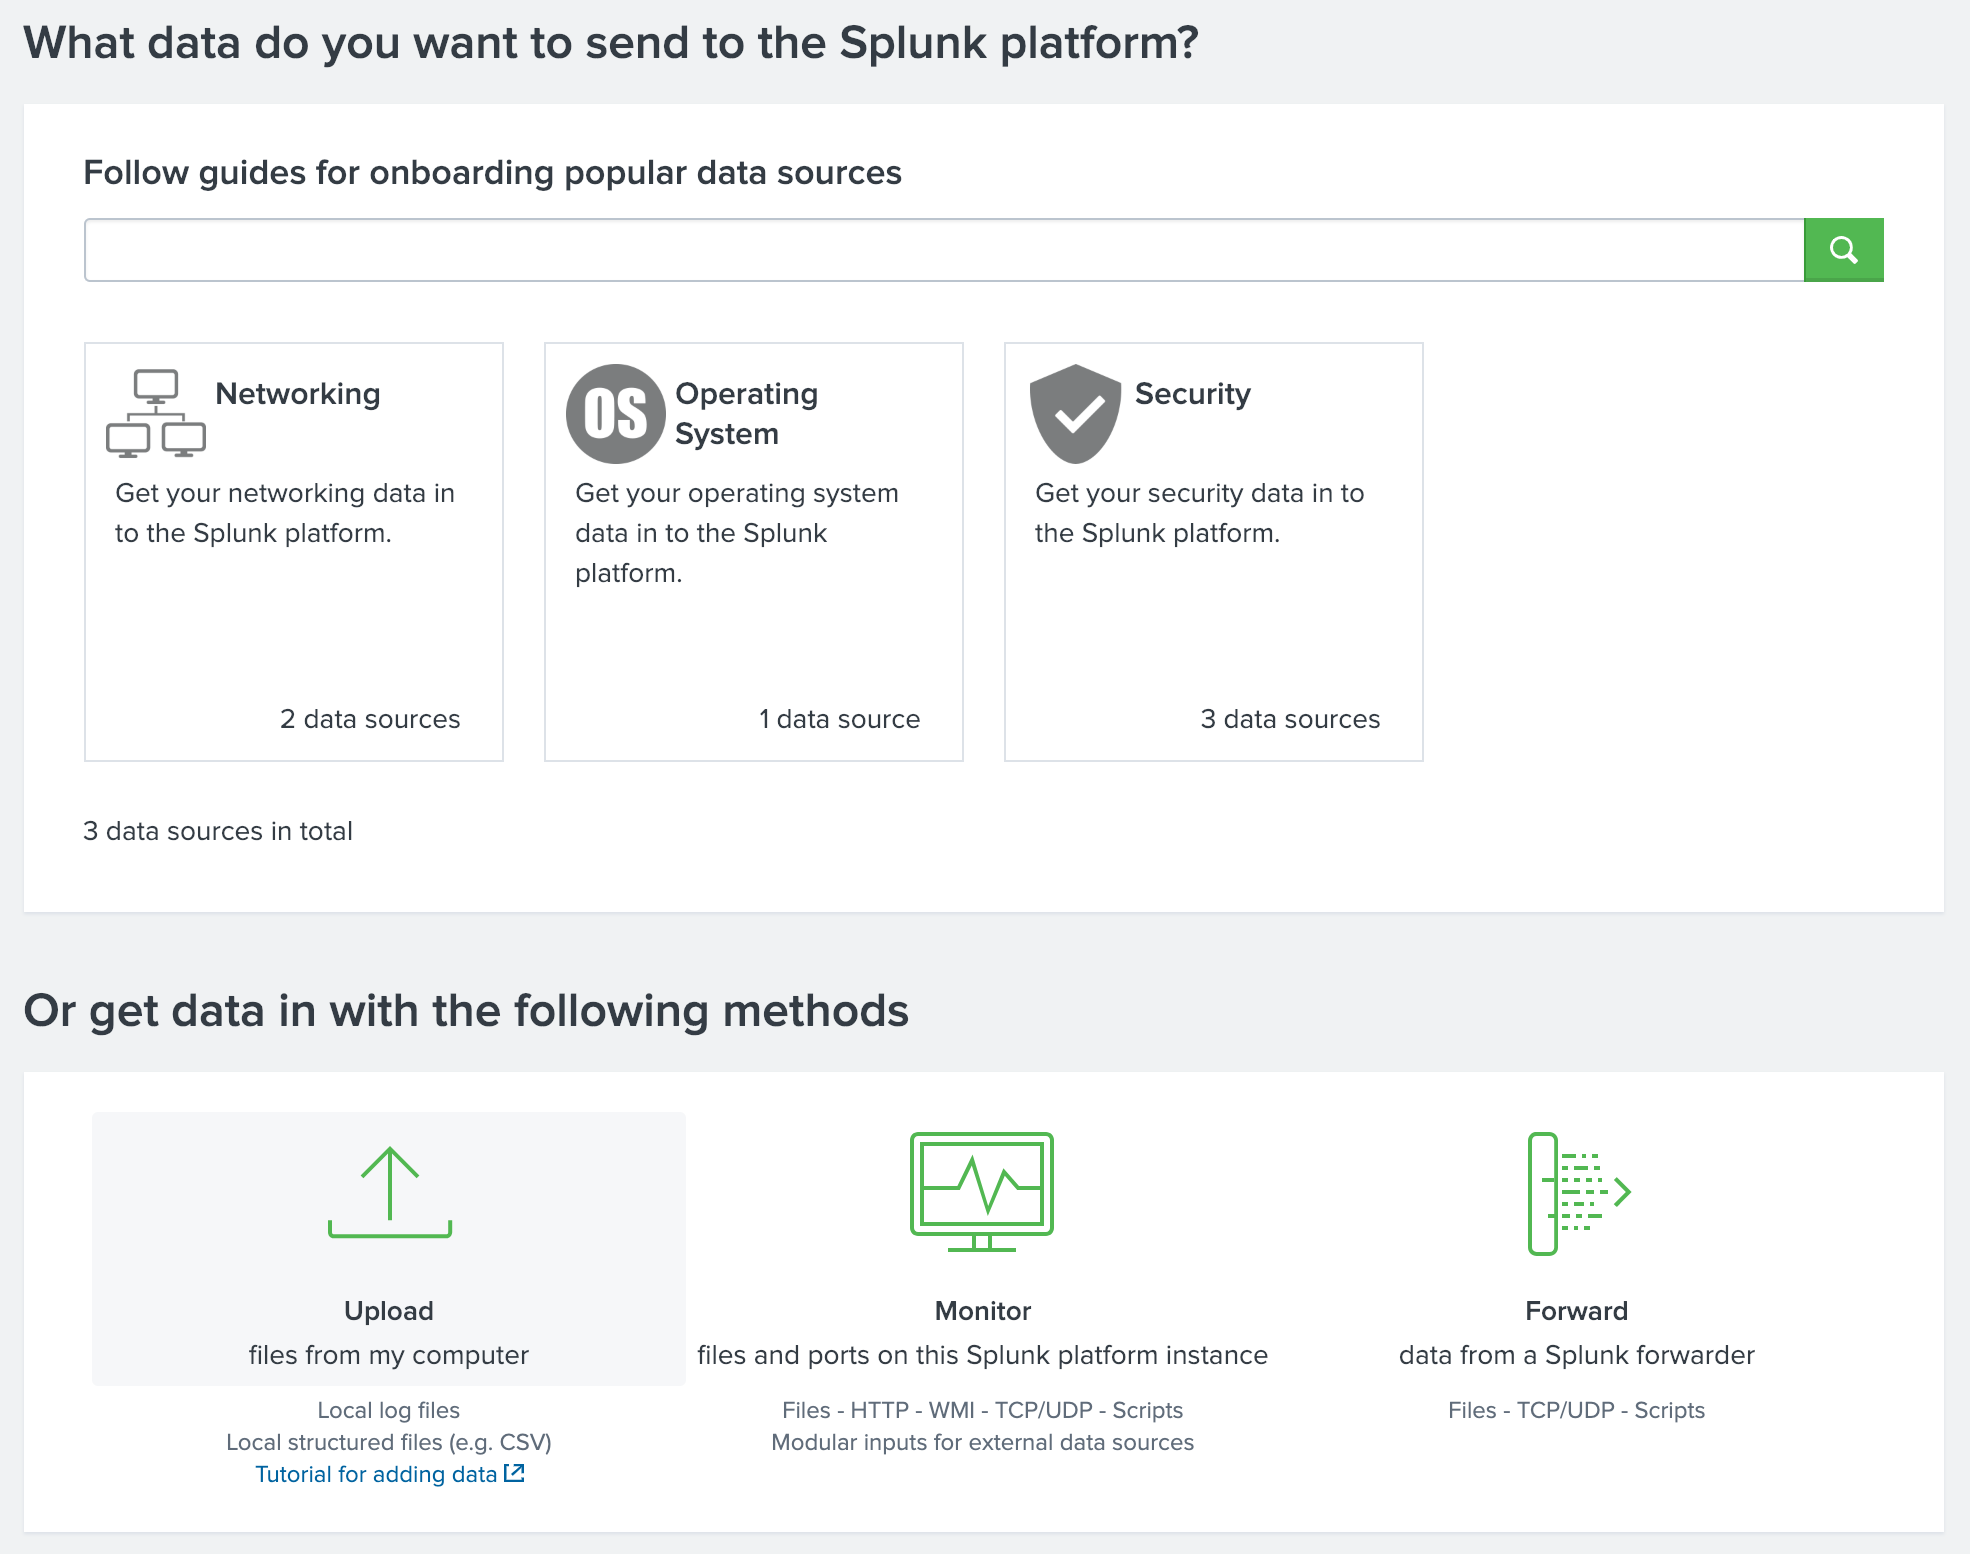
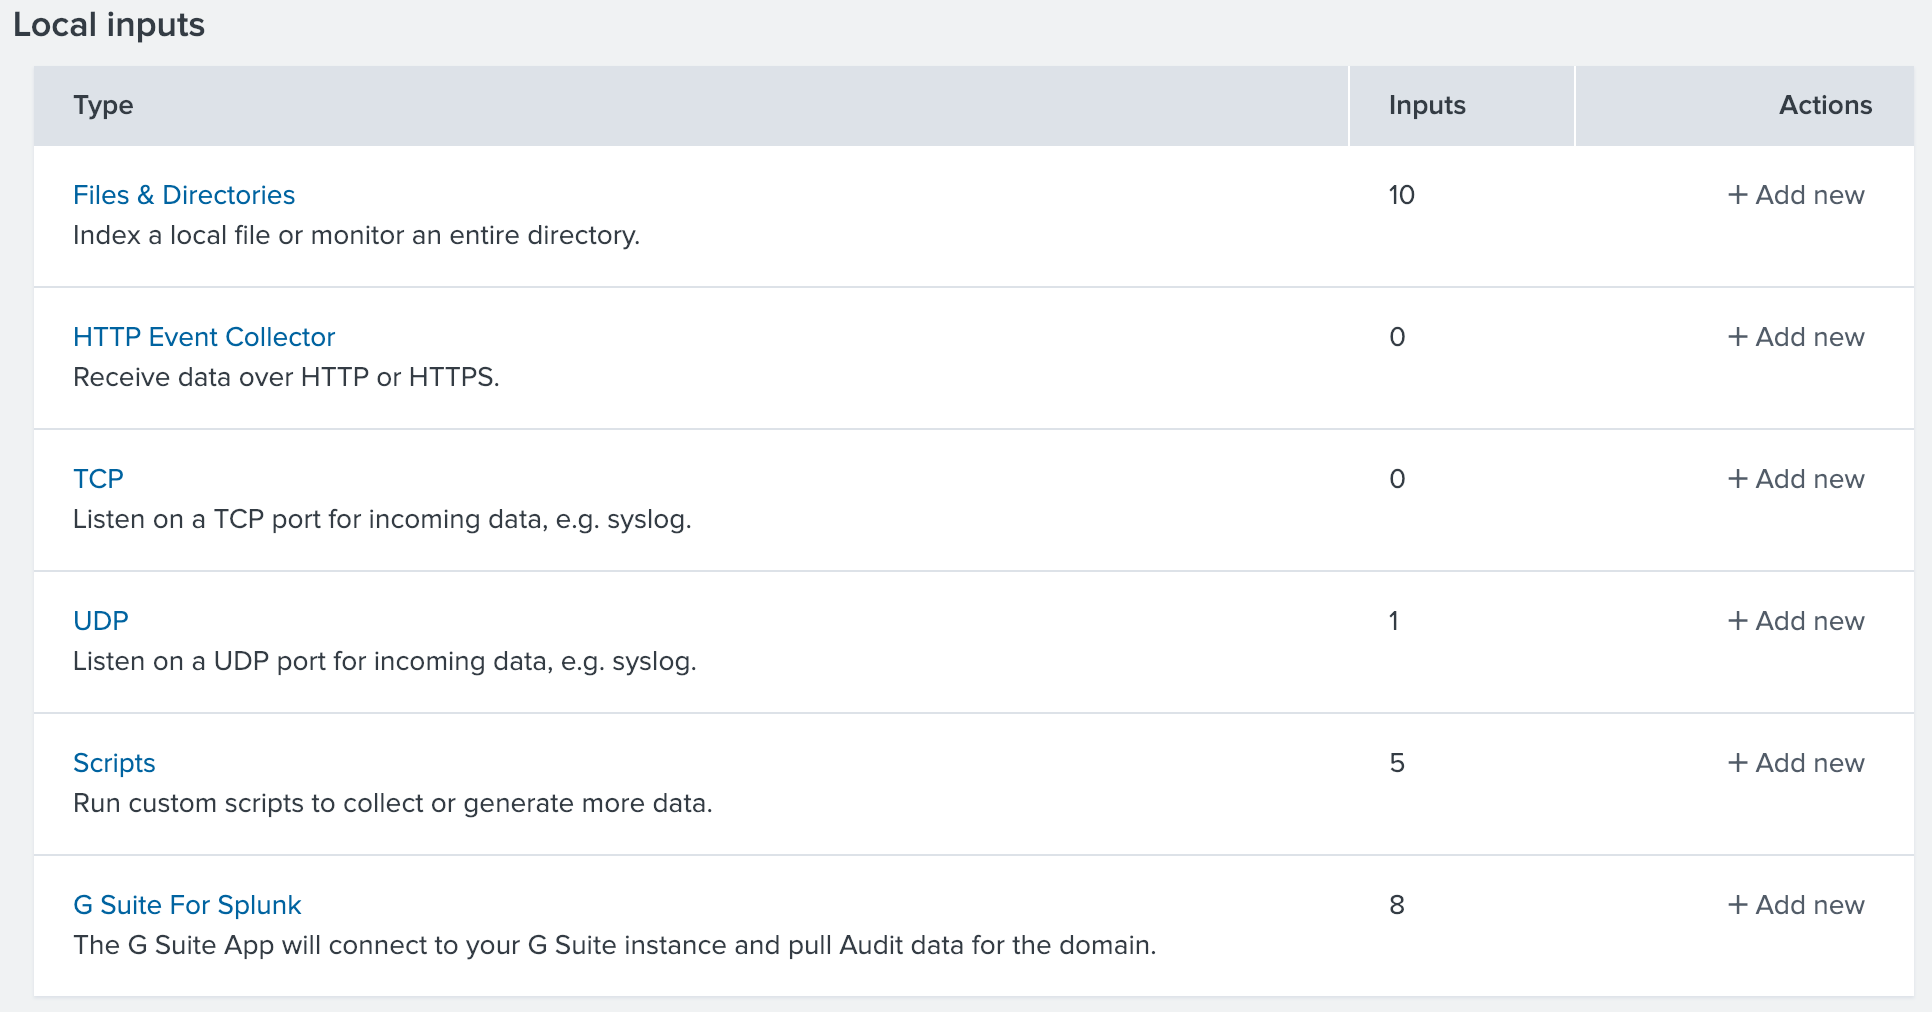
But let’s get into the more interesting topic of importing your own data to Splunk. There a few options to import data to Splunk
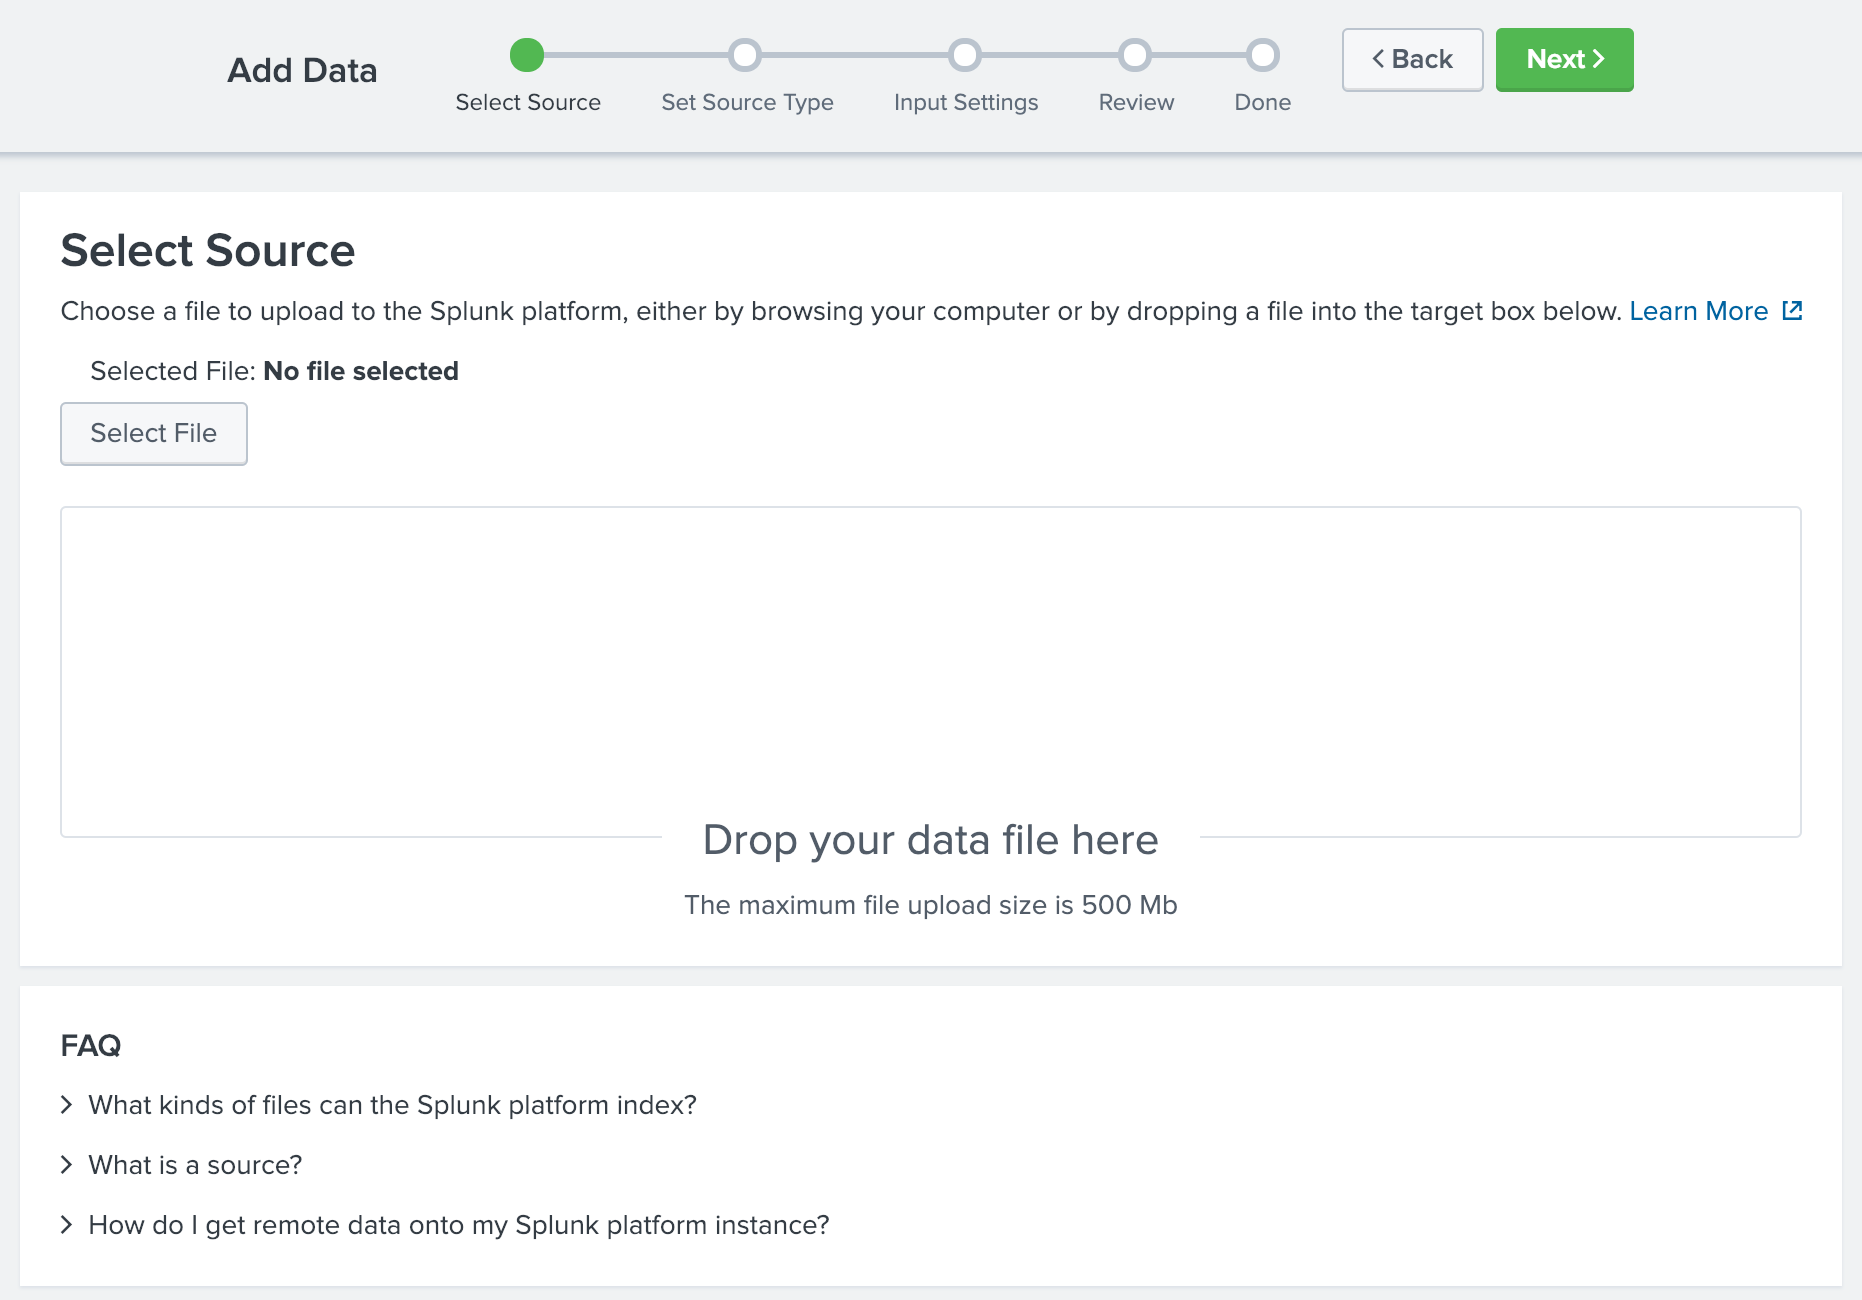
- Upload files from the Splunk Web
- Import files from the Splunk Enterprise Server
- Continuously monitor files in the Splunk Enterprise Server
- HTTP
- TCP or UDP listener
- Apps
- Scripts
How data finds its way into Splunk
This is called ingesting. Where there is a will there is a way - it is highly unlikely you can come up with a format or source that could not somehow be ingested into Splunk.
In real world Splunk use, data is forwarded from external systems to Splunk by different methods supported by Splunk and indexed in real-time. The most used method is using the Splunk Universal Indexers, which are available for a wide variety of platforms.
Using the Splunk Universal Forwarders to import data is highly recommended wherever possible
For testing purposes, you can also just upload files for indexing. When importing data to Splunk, you must define the source type and destination index. These are both very important elements. The source type tells Splunk what kind of data the file contains and helps Splunk to automatically extract known fields from the data already during index time. Splunk also allows creation of new custom source types. The target index defines where the data is to be stored into and also activates any data retention policies and data access policies. Although there are also other methods to limit access to indexed data, indexes are by far the most efficient way although it will require a bit more management overhead. We will look into access management in upcoming posts.
Use case: Import linux system logs
In most Linux systems, you want to collect the linux system logs in Splunk. In most environments, this includes, but is not limited to
- /var/log/messages
- /var/log/secure
We use these two examples, as their format from Splunk point of view is slightly different so the configuration has different sourcetype values for the monitored logs. The input configuration file is /opt/splunkforwarder/etc/system/local/inputs.conf. Importing local linux system logs to Splunk is as easy as adding the following configuration blocks to the inputs.conf -file (if the file does not exist, just create it)
[monitor:///var/log/messages]
disabled = false
index = main
sourcetype = linux_messages_syslog

[monitor:///var/log/secure]
disabled = false
index = main
sourcetype = linux_secure
Note the index definition. If no index is configured for a monitored input, the data will be placed in a default index, which by default happens to be called main. It is good practice to always include the index definition for each monitored input.
After restarting Splunk, the defined files will be indexed by Splunk and data will be placed in the defined index. From now on, Splunk will also continuously monitor these files and index any new data it sees, providing instant, centralised access to the data from Splunk Web. The data will almost instantly be searchable from Splunk Web.
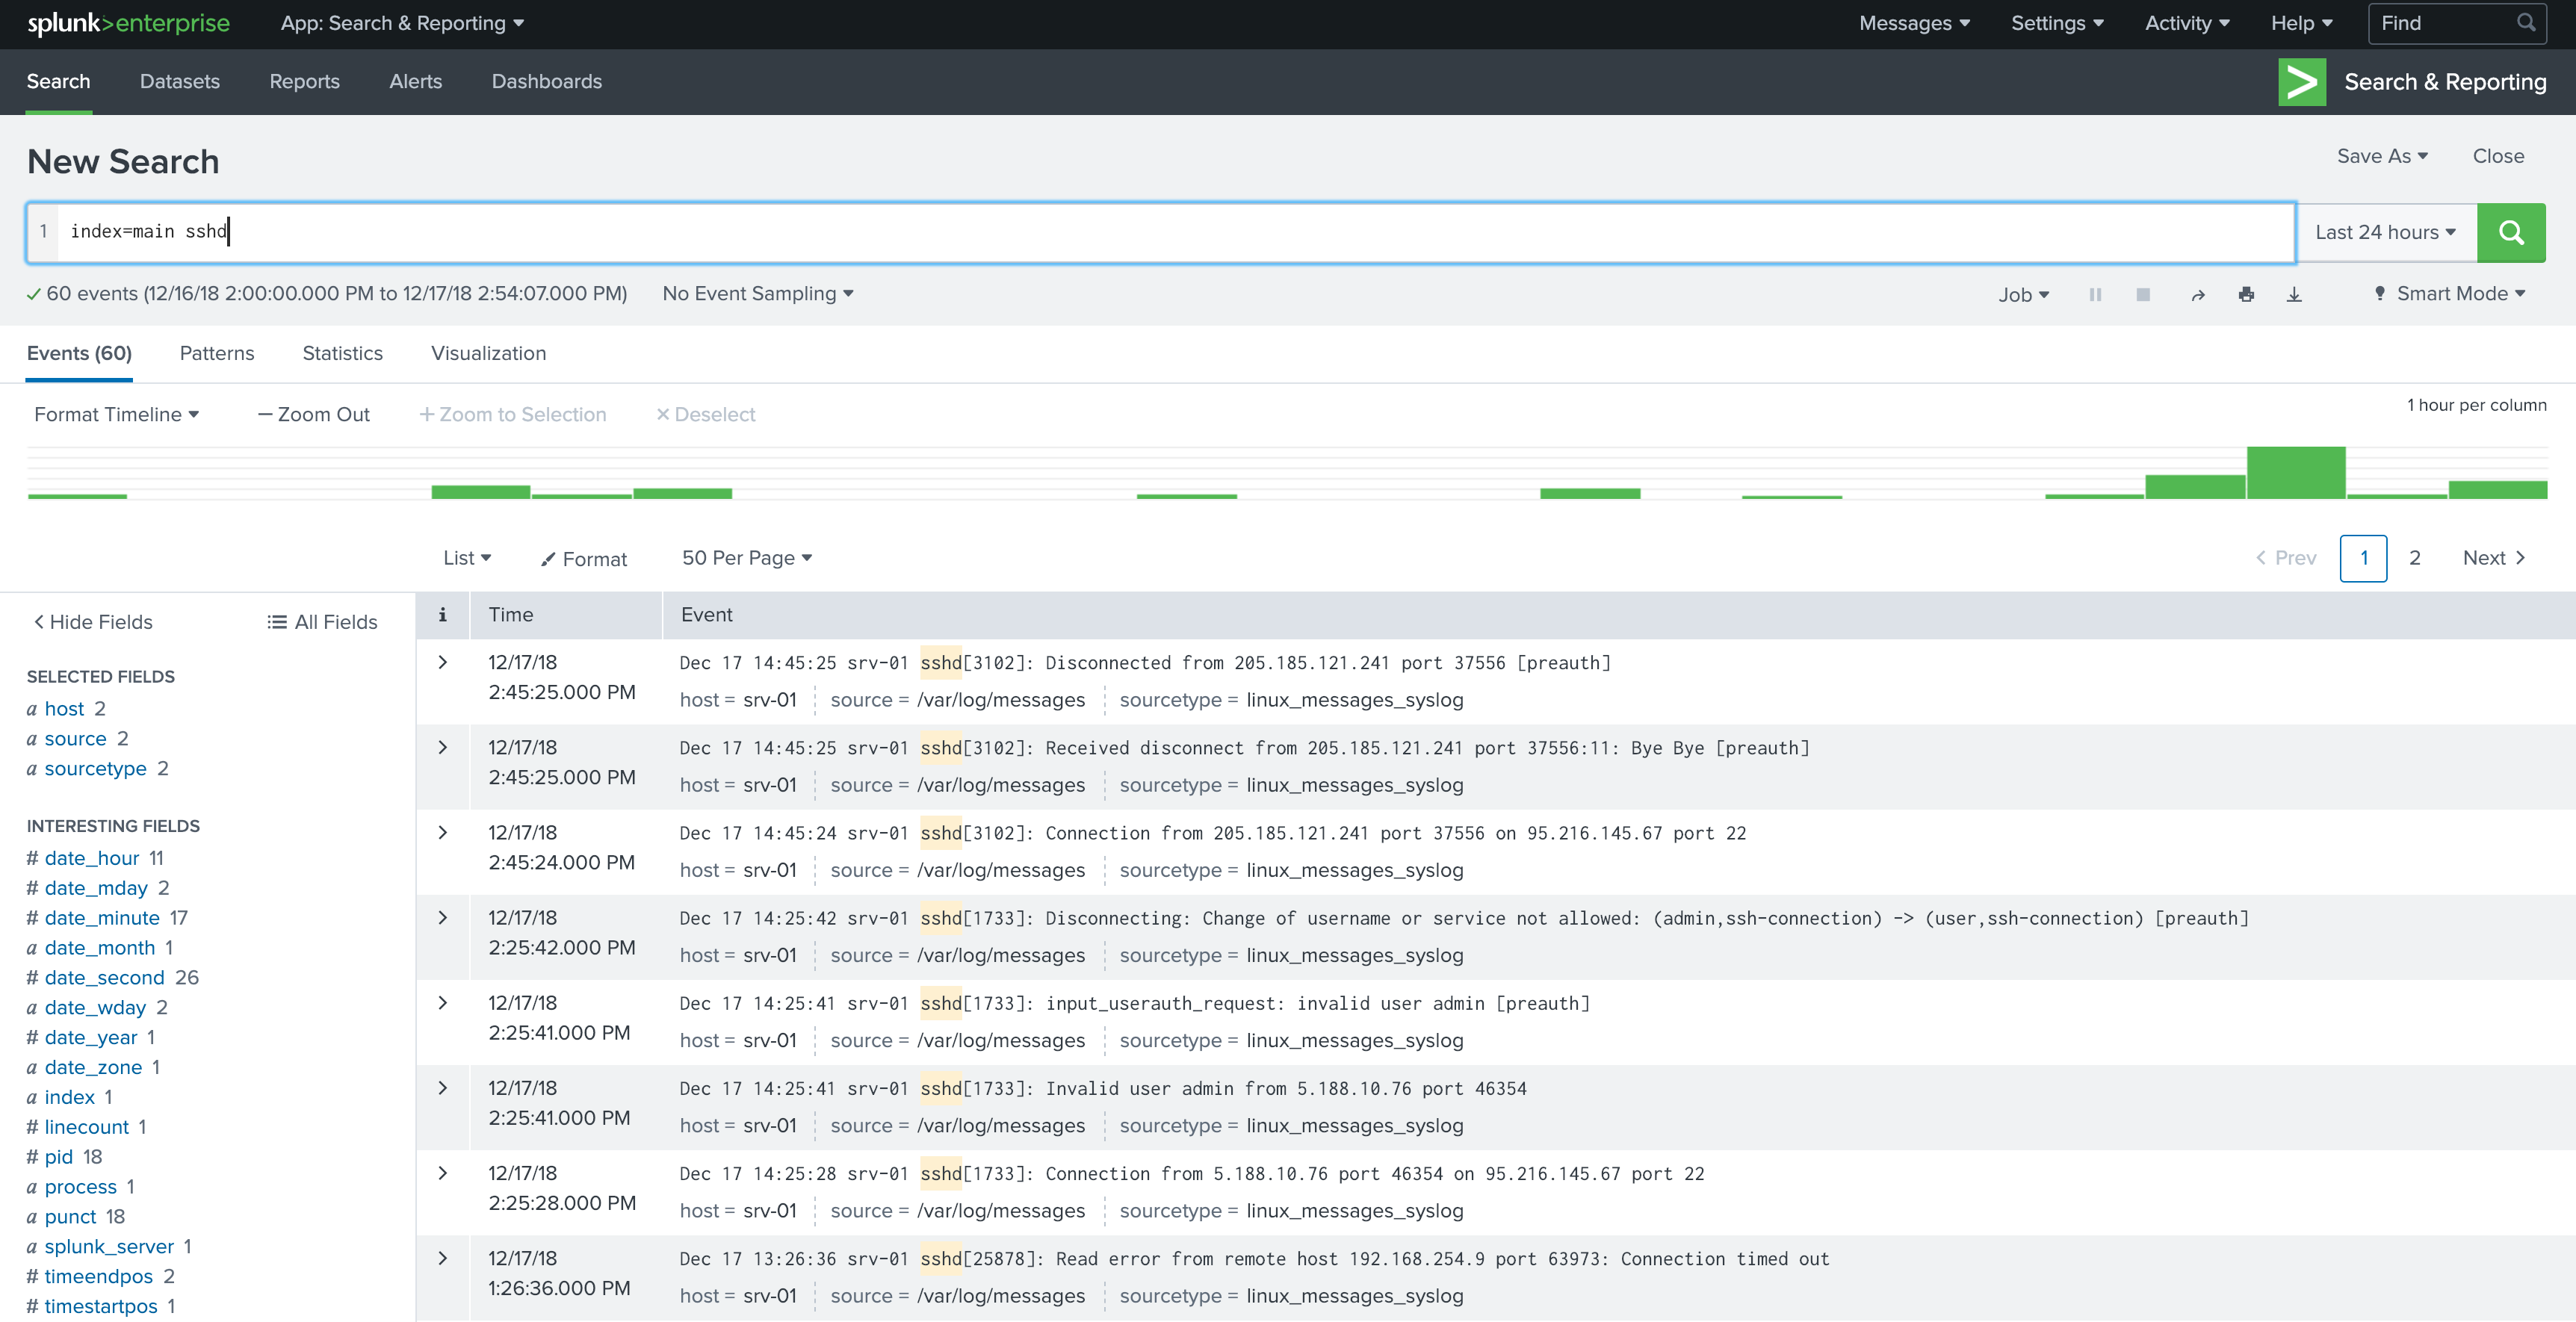
Your first drilldown into the data
This simple example limits the search to data found in the index called main which contains string sshd.
A quick introduction to Splunk configuration
A lot of simple Splunk configuration can be done from the Splunk Web, but getting to know the different configuration files is still somewhat important as when things get more complex, the configuration files are the place one needs to update.
Splunk has a lot of configuration options and each Splunk App has its own configuration file or multiple configuration files. The good thing is that they are all in text format and well documented, making the configuration management easy. This also allows for easy centralisation of all Splunk configuration, which will be covered in a future blog post.
If there is one thing to remember with Splunk configuration files already at this point, it is this:
Never, ever, edit any files under
defaultfolders
Simple as that!
The default folders contain the default configurations which should never be edited. Instead, configure as much as you want with files located in local -folders. Any file available in the folder default, can be copied over to local and modified there, or just create new files and update only the sections and parameters needed. This will keep the modified configurations simple and manageable.
Unchanged parameters should normally not be placed in the local configuration files.
Security
All Splunk communication is by default secured with TLS, except for Splunk Web, which is by default plain HTTP. This can be fixed easily.
Splunk Web has it’s local configuration file of /opt/splunk/etc/system/local/web.conf. TLS can be enabled from the Splunk Web, or by creating the configuration file and setting the following
[settings]
enableSplunkWebSSL = 1
privKeyPath = /etc/letsencrypt/live/splunk.example.com/privkey.pem
serverCert = /etc/letsencrypt/live/splunk.example.com/cert.pem
Using your own certificate and key is advisable, but if they are not defined, Splunk will use the default certificate. Enabling or disabling secure Splunk Web requires a restart. After restart, Splunk Web is still available in the same port of 8000, but will be usable only with HTTPS. Like in the example, you can also use a free certificate from Let’s Encrypt.
Final words
We have quickly scraped the surface of Splunk. In the next post, we will look into getting remote data to Splunk Enterprise and what to take into consideration when planning a Splunk Enterprise Architecture. Stay tuned.